

Financial Snapshot
| ➢ Financial Snapshot (Sample) |
|---|
|
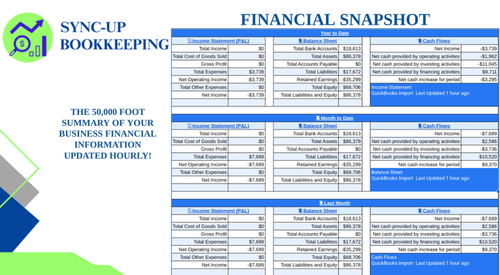
The Snapshot report provides a high-level, 50,000-foot overview of a company's financial performance, summarizing key data from the three main financial statements: the Income Statement, Balance Sheet, and Statement of Cash Flows. This concise report offers a quick and easy-to-understand snapshot of the company's overall financial health, highlighting key trends and insights for decision-making. The report is divided into three sections:
The Snapshot report is a valuable tool for busy executives and business owners who need a quick and concise overview of their company's financial standing. By analyzing this report, they can identify key trends, potential areas for improvement, and make data-driven decisions to achieve their financial goals. |